Before beginning any data analysis, a necessary step is cleaning the data to avoid drawing incorrect conclusions from problematic data. But how do we evaluate whether data is “good” or not? The two key aspects to assess are:
- The structure of the data
- The content of the data
Good Data Structure / Tidy Data #
A dataset with a good structure—also known as tidy data—should follow these three rules:
- Each column represents one variable
- Each row represents one observation
- Each cell contains a single value
Data that doesn’t follow these rules is often referred to as messy data.
Some tables may look structured at first glance. For example, the table below shows tuberculosis cases by age group:
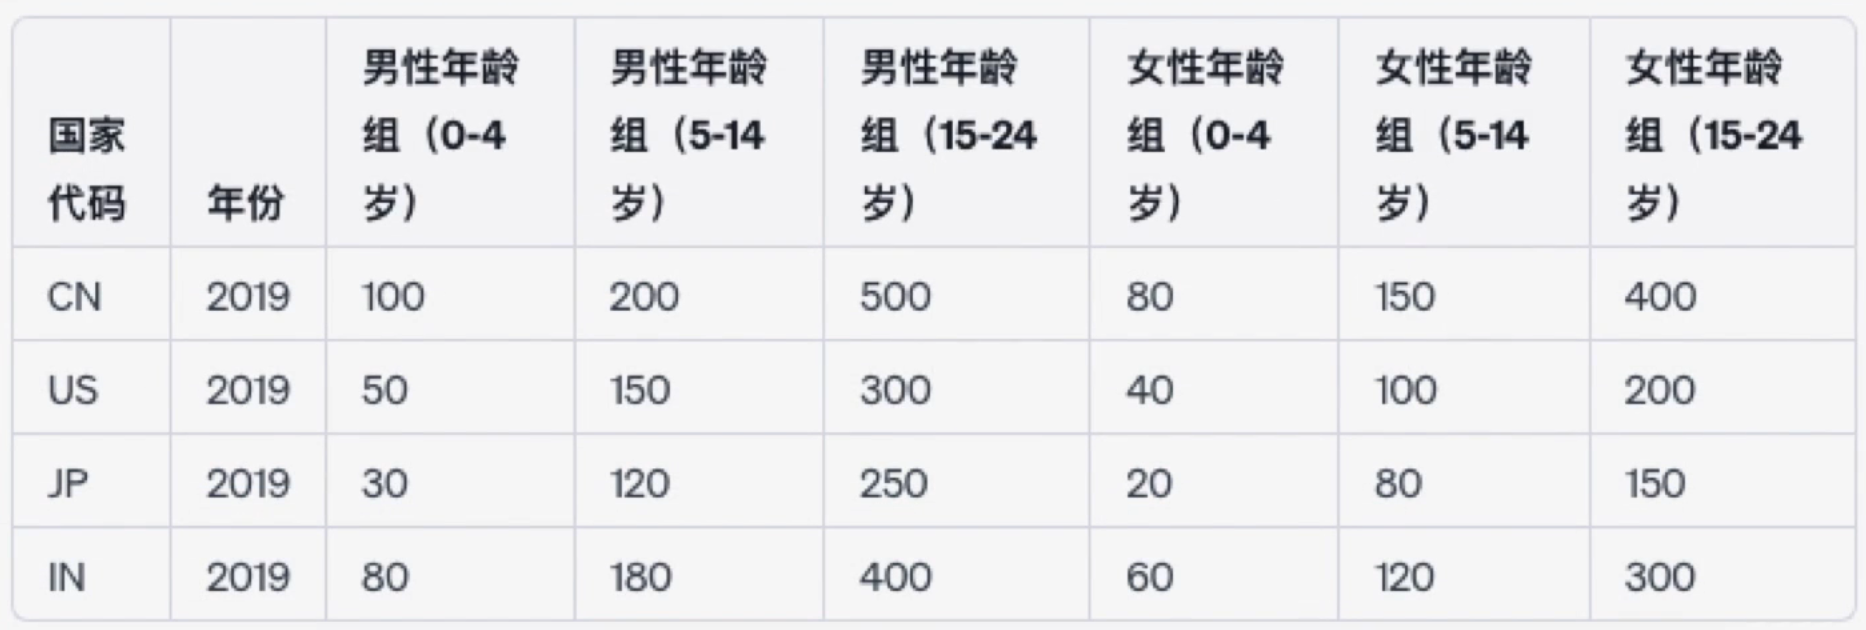
However, this violates the rule that “each column should represent only one variable,” because each column like “Male age group (0–4)” contains two variables: age group and number of cases. A tidy version of this data would look like this:
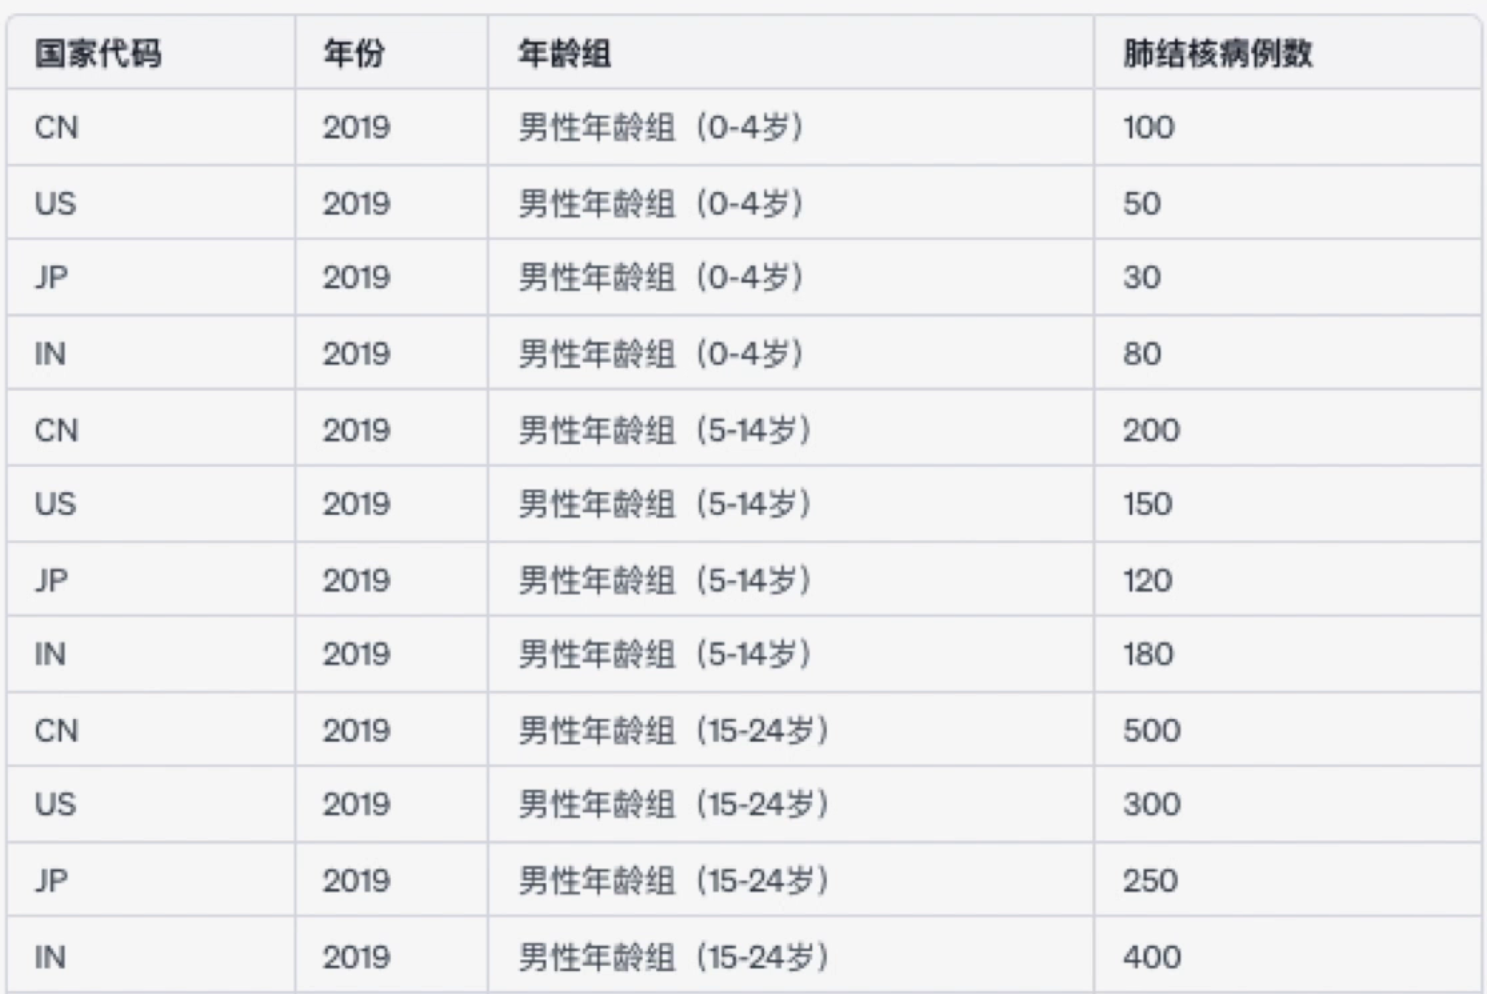
While the tidy format may be harder to read at a glance, its purpose is to make the data easier to analyze programmatically, not necessarily easier for humans to read.
Good Data Content / Clean Data #
A dataset with high-quality content is referred to as clean data, while the opposite is dirty data. Dirty data typically has the following issues:
- Missing values
- Duplicate entries
- Inconsistent values
- Invalid or incorrect data
Point 3 deserves further explanation: inconsistent data refers to different expressions for the same value within a column. For example, if students from “Class 1” are recorded as “Class No 1”, “Class 1.0”, and “Class A”, these inconsistent formats represent the same class but may disrupt data processing.